

Advanced Substack Metrics, a Recent Case Study …
I’ve identified more “curious” Substack metrics from my analysis of a story I wrote that (maybe?) went viral thanks to a cross-post from Steve Kirsch.

Author’s note: Readers who never enjoyed math might not be my target audience for this dispatch. However, the math I use below is not “advanced” at all. In fact, I’d mastered the basic addition, subtraction, multiplication and division I use in this article by 8th grade. (A belated thank you to my Troy City Schools math teachers, circa 1977-1983).
For Substack authors who are interested in “Subscriber Metrics,” please read my Conclusion Section where I’ve included a homework assignment for colleagues and also came up with several essay questions which interest me.
Also, this piece is not all math. I also use a fair amount of text to discuss the theory that the “over-saturation” of Substack newsletters accounts for most of the noticeable changes in Substack metrics.
***
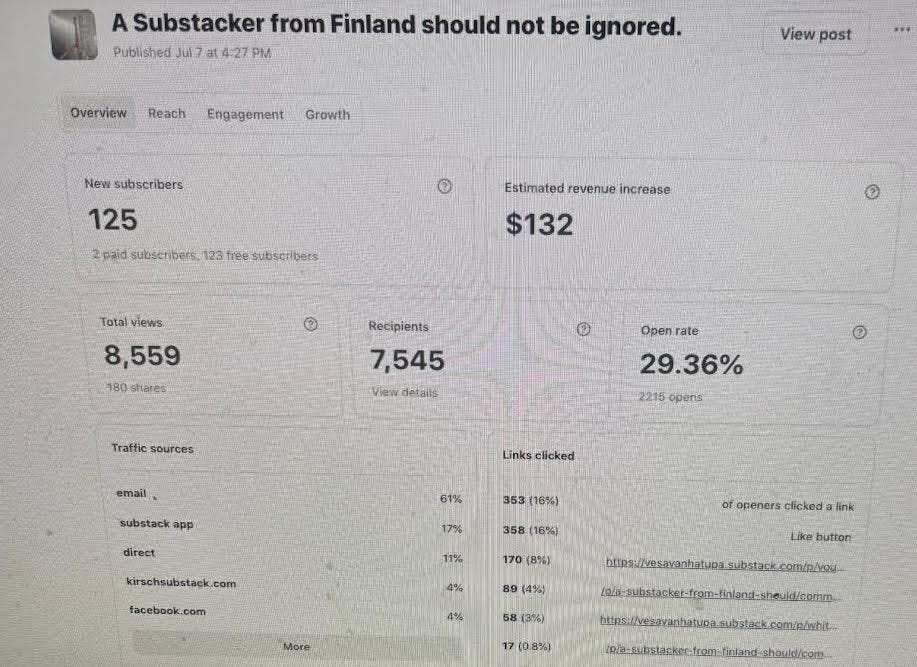
Per this screenshot (from Substack metrics), my article “A Substacker from Finland should not be ignored” generated a total of 8,559 “Page views.:
Note: This article might have been the most noteworthy I’ve published yet as the subject matter (“the embalmers’ clots”) actually was “trending” on Substack for at least two hours Sunday. I should note that the main reason this story (kind of) went viral is that Steve Kirsch cross-posted my article late Saturday night.
You’ll see; this is very simple math …
Per Substack-provided metrics, of the 8,559 readers who read this article, 2,215 were already subscribers of my newsletter.
This means that 6,344 non-subscribers apparently read or opened this article. This is the cohort of readers who could become “new subscribers.”
One can calculate the key metric “new-subscribers-generated-per-article” two different ways.
The easiest way is to simply look at Substack’s computer field labeled “New Subscribers.” Per this screen shot, this particular article generated 125 new subscribers (123 free and two “paid” - one $60 annual sub and one $6/month sub. Thank you very much!)
Thus, from my pool of 6,344 subscriber prospects, 125 Substack users hit the “subscribe” button and became subscribers. This would represent a “conversion ratio” of 1-in-50.7 readers.
Said differently, two (2) percent of my non-subscriber readers became subscribers after being exposed to my article. (Math: 6,344 readers produced 125 subscribers = approximately 2 percent).
As I’ve quantified in previous Substack metric articles, in recent months a typical article of mine generates, on average, only 1.3. new subscribers per article.
A typical article of mine is read by about 2,200 subscribers and slightly more non-subscribers (about 2,300). Presumably, these non-subscribers are finding my articles via shares, cross-posts or other unknown means.
Thus my “subscriber conversion ratio” for a typical article is approximately 1-in-2,300.
One obvious question that’s occurred to me: why do at least 2 percent of my new readers decide to subscribe after reading one of my articles, but only 0.043 percent (1-in-2,300) choose to become subscribers for all my other articles?
Another question: Among the cohort or universe of “Covid contrarian” readers, what’s so different about Steve Kirsch’s readers? Why do so many of them, quickly, choose to try out my newsletter via a free subscription, but virtually nobody makes the same decision with all my other articles?
(Side note: In the last five or so months, I’ve only had two other big spikes in subscriber numbers. These happened when Jenna McCarthy and Dr. Meryl Nass cross-posted articles of mine, both cross-posts (thank you, very much) produced at least 41 new (free) subscribers for my newsletter.
Again, my thought is Dr. Nass and Jenna’s readers seem to like my articles as scores of their subscribers instantly became free subscribers after these two authors shared my writing with their audience.
This thought exercise leads me to conclude that maybe I haven’t lost my Mojo as a writer. If the right readers see my stuff, many will still become subscribers … just like, once upon a time, happened all the time on my Substack.
As I recently documented, in a 60-day period two years ago, every article I posted produced, on average, at least 23 new subscribers. In April and May 2025, every article I published produced, on average, 1.3 new subscribers.
The Over-Saturation Theory …
Many readers and some Substack authors have told me that the reason my “new-subscriber-per-article” metric has plunged by approximately 95 percent is explained by the “over-saturation” of Substack newsletters.
The explanation is that every Substack subscriber is subscribing to far too many authors to ever read all this content - the email in-boxes of Substack clients are being flooded with unread dispatches - and so almost every Substack reader has simply decided, “I’m going to quit subscribing to any more newsletters; I already have too many to read.”
I AGREE that this is a major reason that probably the vast majority of “Covid Contrarian” authors have experienced major “trend changes” in their metric “new subscriber-per-article.”
However, the Steve Kirsch “case study” illustrated above (as well as my Jenna McCarthy and Meryl Nass case studies), seems to show that significant numbers of Substack readers will still subscribe to a new author they like.
That is, I don’t think the “saturation” argument/explanation fully or completely explains all of these metric changes.
I also note that “subscriber over-saturation” clearly isn’t deterring liberal readers from subscribing to their favorite “Status Quo-protecting” authors as many of these authors generate thousands of new subscribers with every article they post.
The take-away from this observation might be that “over-saturation” is a big deal to conservative readers who prefer the content of “Contrarian” authors, but the same dynamic is not at work for Statist writers, who are clearly killing it or “blowing up” on Substack.
In one sense, this might, perhaps, make sense as one could observe that the population who discovered “Covid Contrarian” writers has been on Substack much longer than the flood of TDS “newbies” who discovered Substack in recent months. In other words, my “target market” has had much longer to become “over-saturated” with newsletters.
If this is true, I would predict that in, say, a year that Paul Krugman, Robert Reich, Mayor Pete, Jim Acosta and Terry Moran are going to experience a massive decline in their “new subscriber” numbers as liberals citizens also start to compile 40 to 100 newsletters they rarely read or open.
(Conversely, if the same thing that’s happened to veteran “contrarian” authors doesn’t happen to these authors, a few skeptics are going to ask, “What’s up with this?”)
This theory stipulated, I still wonder why “over-saturation” is the main driver of Substack trends for readers with a conservative or skeptic bent of mind, but not for citizens who are looking for the same type of content they’ve always gotten from the MSM.
The 2nd way to calculate new subscribers …
I actually think my ratio of “new subscribers produced per article” might be more impressive than the 2-percent ratio outlined above.
As noted, one can calculate “new subscribers” through two methods of metric analysis.
The other way to do this is simply note the number of total subscribers your newsletter had on a given date and then note the number of subscribers your newsletter has, say, two days in the future … and then subtract the bigger figure from the smaller figure.
As noted, the first method showed that I generated 125 new subscribers from my article about “Vesa Reports.”
Per another Substack metric - one that shows authors how many subscribers authors have on two given dates - I learned that my newsletter had 7,579 total subscribers on July 11th. Two days later - after Steve Kirsch cross-posted my article - I suddenly had 7,947 total subscribers.
Simple subtraction tells me that I added 368 (!) total subscribers - not 125 - thanks, primarily to Steve (as well as many other Substack authors) cross-posting this article.
As I see no evidence any of my older stories suddenly generated more than a couple new subscribers, I assume this eye-opening spike must have been almost completely caused by one cross-post from an author who has 34.3 times more subscribers than I have (260,000 vs. 7,562).
The metric screen shot shown above also informs me that 4 percent of my “traffic” for my “Vesa Reports” article came from Steve Kirsch’s subscribers.
Again, from simple math, this tells me that if my article had 8,559 page views and 4 percent of this “traffic” came from Steve’s subscribers, then Steve sent me a grand total of 342 new readers (math: 8,559 Page Views x 4 percent from Steve’s subscribers = 342).
This metric is clearly preposterous.
For starters, I know (if Steve’s published subscriber numbers are accurate) that Steve has 260,000 subscribers.
I don’t know exactly what percentage of these subscribers actually open and read a given Steve Kirsch dispatch or cross post.
From my own metrics, Substack tells me that about 29 to 34 percent of my subscribers open my articles and cross-posts.
If 33 percent of Steve’s subscribers received the Bill Rice article that Steve cross-posted, this would be more than 85,000 new readers Steve graciously sent my way (math: 260,000 subscribers x 33 percent Open Rate = 85,900).
So I don’t have a clue how many new readers actually read my article on Vesa Vanhatupa.
The figure might be as low as 342 (4 percent of my total traffic came from Steve’s newsletter).
It might be 6,344 (see above extrapolation where I subtracted the number of my subscribers who opened this article from the total Page Views this article generated).
Or it might be 85,900 (assuming 33 percent of Steve’s 260,000 subscribers opened the cross-post he sent out to all of his subscribers).
I’d say the figure must be somewhere in between, although 342 to 86,000 is a pretty sizable “range.”
FWIW, if 6,344 non-subscribers read my article and 368 (presumably non-over-saturated) readers decided to hit my “subscribe” button, this would equate to a conversation ratio of … 1-in-17.2 readers! (Math: 6,344 non-subscriber readers divided by 368 subsequent new subscribers = 17.2.)
If this is true, 5.8 percent of these new readers decided to become subscribers at my newsletter - which might tell me, “Bill, you’ve still got it! You haven’t lost your Mojo as a writer.”
Which, again, begs the question of why 97 percent of my other articles generate new subscribers at a ratio of 1-in-2,300.
Am I writing about a topic few readers care about?
Lastly, some readers and Substack colleagues have politely told me I could be turning off my readers by writing so many topics on this subject, which most readers don’t care about.
However, my rejoinder to this observation is that my article that produced all-time personal records for most paid subscribers (40!), “likes,” “reader comments,” cross-posts and total subscribers was a story I wrote 18 months ago … about curious or possibly alarming developments on Substack!
Dr. Robert Malone cross-posted that article, which tells me that the “Covid Contrarian” with more subscribers than any of us is also interested in the same subject.
I would also add that one reason I keep writing about this topic is hardly anyone else on Substack is doing the same thing. If my “brand” at one time was as Substack’s “Early Spread Guy,” maybe I can also become known as “The Substack Metrics Guy.”
***
The other obvious lesson from this dispatch is that the key to growing one’s subscribers is to have a better-known Substack author cross-post or share your article(s).
(Here, I note that Vesa Reports’ subscribers have increased more than 10-fold since I wrote about Vesa’s important Substack, a newsletter that had only 87 subscribers before I highlighted this Substack and before Steve indirectly promoted Vesa Reports with his cross-post.)
Memo/suggestion to colleagues: If you want to help our cause even more, send out more cross-posts that promote important under-read Substacks.
++++++++++++++++++++++++++++++
Homework assignment for other Contrarian Substack authors …
Feedback from other Substack Contrarian authors who’ve done a similar analysis of their own metrics would be greatly appreciated. Possible homework assignments:
Go back two years and tally how many new subscribers your articles used to produce on average. How many new subscribers are your new articles producing? Can you tell a notable difference in these two numbers?
Has your newsletter also experienced major spikes in new subscribers when a well-known author cross-posts one of your articles?
If this has occurred, why do you think this new-subscriber conversion ratio is glaringly higher than articles you publish that don’t get cross-posted by a prominent colleague? Why do think your other articles produce a much-smaller ratio of new subscribers from your non-subscriber readers?
Possible Essay questions:
Do you think your Substack subscription growth has already peaked?
If you think this, do you think the “over-saturation” issue is going to change? Do you think it will perhaps, become worse?
In the future, do you think your Substack newsletter is going to reach significantly more readers than you are currently reaching, enough to make a difference and perhaps allow the mainstream public to recognize that many authorized narratives are completely bogus?
In your opinion, how likely is it that Substack will be the content platform that allows truth-seekers to debunk false, widely-accepted narratives?
If Substack no longer has real potential to achieve this goal, what writers’ platform will allow this goal to be achieved?
Could you share any ideas or opinions you might have on the utility of someone introducing a writer’s platform that might be superior for independent writers and more popular with over-saturated subscribers?
Should I quit writing about this topic or is it okay for at least one Substack author to use Substack to ask questions like this?
In your opinion, do Substack trends matter? If so, why?
… Don’t let your dog eat your homework!
***
(Thank you to everyone - maybe 368 people around the world, maybe 125 - who recently gave my Substack newsletter a try. Don’t worry. Most of my articles will NOT be on “Substack metrics.”)
My current stats from the last three days are these:
7416 views and 700 new subs
Top view sources are:
Direct - 2577 views, 1211 users, 112 new subs
Email - 1807 views, 1376 users, 28 new subs
Substack App - 1712 views, 873 users, 145 new subs
Bill Rice jr substack - 649 views, 260 users, 38 new subs
At the very bottom of the "Traffic by Source" table are these two categories: "email-upsell" and "substack dot com", which have no "views" or "users" listed, however these have brought me lots of subs. The "email-upsell" brought 61 subs and substack dot com brought 256 subs.
Also there have been lots of views from various search engines, with a very high "new sub" percentage in comparison to the user amounts. For example from the search engine duckduckgo I got 58 users and 23 new subs. Maybe these were the people who were searching for "vesa reports", and possibly also those subs that just came from "substack dot com" actually came through the substack search, and these are the people that caused the words "vesa reports" to trend.
I don't know how you have the time to do these analyses, but I sure appreciate them. (I restacked with a similar note.) Looking forward to commentary here...