Official Flu Data is Exceedingly Curious
Case, death and hospitalization estimates are always dramatically ‘revised;’ the 2019-2020 data should not be believed & the flu “vaccine” clearly doesn’t work … plus other contrarian points.

Author’s note/why this article might be of interest to readers:
Before official Covid, the primary goal of public health agencies was the aggressive, never-ending marketing of “life-saving” flu vaccines, indoctrination campaigns which accelerated rapidly in 2000-2005.
While flu vaccines are undoubtedly a cash cow for Big Pharma and increasing “vaccine coverage” has been the primary focus of public health agencies for 25 years, the data presented below show that flu vaccination has done nothing to reduce the incidence of flu-like illnesses.
My Substack colleague Mark Oshinkie has labeled the response to Covid the world’s greatest medical “Scamdemic.” Per my analysis and conclusions, the hyper-focus on the flu and the “flu vaccine” should qualify as another massive Scam.
Today’s in-depth analysis, which I hope is somewhat original, should make more readers aware of the many components of the “flu narrative” that are non-sensical or dubious.
***
For more than five years I’ve been reading, saving and thinking about numerous articles and papers I’ve found on various “flu seasons.”
The main reason for this odd interest is I was seeking to cite “official” evidence that supported my hypothesis that far more Americans than was typical became sick in the flu season of 2019-2020 (in the weeks and months before “official” Covid).
If this is true (which it clearly is), this would support my hypothesis that a (perhaps) “novel” coronavirus was making tens of millions of Americans sick before official Covid. As most of my readers must know by now, I call this hypothesis “Early Spread.”
Main take-aways from today’s article:
Statistics on the key flu-season metrics - “cases” (or “illnesses”), “hospitalizations” and “deaths” - are almost always significantly inflated during a given flu season … and/or dramatically adjusted downwards in the months and years after these flu seasons …
This, in my opinion, is an obvious effort to produce maximum fear of “the flu” and, thus, scare more people into getting that year’s flu “vaccine.”
Citizens with discernment should take CDC flu estimates with a grain of salt. (I wonder if certain “flu season” numbers are simply “made up out of thin air.”)
According to estimates used for more than nine months, the 2019-2020 season did, indeed, comport with a flu season that could be accurately-described as one of the worst in 40 years - which would jibe with my “early spread” hypothesis.
However, flu season estimates for 2019-2020 were dramatically revised downwards and this flu season is today considered to be only “moderate” as judged by “cases” and seems to have been quite mild as viewed by the metrics or “flu deaths” and “hospitalizations.”
I believe these statistical adjustments or “revised estimates” were likely an effort to conceal evidence of Early Spread of Covid.
Quick tease of a coming article …
In an upcoming, in-depth article, I will develop the reasons I believe a novel virus (almost certainly created in a lab) was, indeed, circulating in America and around the world. This article will present the reasons I believe “Covid” is, in fact, a real disease - in fact, a virus that is or was more contagious than other viruses, but, significantly, not a noticeably “deadly” virus.
Points supporting this thesis will quantify (via several key metrics) that far more people became sick in the pre-Covid months than normal or previous flu seasons … and symptoms of “sick” people (while almost identical to typical influenza viruses or ‘bugs”) were unique in several aspects, according to voluminous anecdotes shared by citizens in myriad Reader Comments sections.
***
Today’s analysis focusses primarily on statistics published for three consecutive flu seasons - the flu season of 2017-2018 (said to be one of the worst in “four decades”), the flu season of 2018-2019, which produced elevated levels of influenza-like-illness for a record number of weeks (until 2019-2020) … and the 2019-2020 flu season - the season that, in my opinion, tracks the beginning of real spread of a novel coronavirus.
In this article, I also present information and opinions regarding:
The “effectiveness” of flu vaccines, which were estimated to be 10 to 47 percent effective in these three seasons (Re-stated: 90 to 53 percent non-effective.)
Information about the 2009-2010 Swine Flu Pandemic, which produced more “cases” (61 million) than any flu season in decades (although few people with “Swine Flu” seemed to have experienced symptomatic illnesses.) To me, the Swine Flu Pandemic provides evidence that a widely-circulating virus can be far less deadly than a typical flu season - identical, IMO, to the copious evidence of ‘early spread” of Covid.
I also present statistics on the number of “lives saved” and “illnesses prevented” by the flu “vaccines,” according to the CDC’s vaccine propaganda experts. As there is no way to prove these assertions, readers can judge for themselves whether these figures were simply “pulled out of the air.”
Note: While this article does include several links, many of the links to “flu burden” stories and statistics are “no longer available.” However, I saved all key text and statistics used in this analysis and readers have my word that I have not made up any of these numbers or excerpts.
Flu Season of 2017-2018 Estimates and Revisions
Cases:
48.8 million (December 2018 Estimate)
45 million (November 2019 Estimate)
41 Million (Current Estimate)
Note: The final estimate - 41 million cases - was published approximately two years after the flu season of 2017-2018 officially ended (in May 2018).
As an editorial comment, I wonder if these “flu case estimates” might have been reduced to prevent skeptics from comparing the number of “Covid cases” to the number of flu cases in this historically “severe” flu season. (The thought being that “stagers” of the “Covid Pandemic” might not have wanted “Covid skeptics” to be able to claim that more people, or far more people, became sick from another respiratory virus just two years earlier).
Symptoms seem to matter with the flu, but not with Covid …
I also believe the criteria used to identify “flu cases,” which includes evidence that someone developed “flu symptoms,” is markedly different than the criteria to identify “Covid cases,” which requires only a positive PCR test (often at cycles of 35 to 40-plus amplification). As a general statement, PCR “positive cases” have nothing to do with the existence or severity (or lack thereof) of ILI symptoms.
Even today, it’s still unknown what percentage of “Covid cases” were asymptomatic or occurred among people who experienced only very mild symptoms. This percentage might be as high as 50 to 80+ percent.
Speaking for myself, I’ve never heard of an “asymptomatic case” of flu. That is, I’ve never heard anyone say, “Yes, I’ve got the flu, but I don’t have any symptoms.”
Conversely, accounts of Americans who reported they “had Covid, but feel fine” were omnipresent for years.
*** (Thank you for sharing with any serious Covid students or data-analysis nerds. Some parts of this research project might be fairy original.) ***
Deaths:
79,400 (Dec. 2018 Estimate)
61,000 (November 2019 Estimate)
52,000 (Current or final Estimate)
Note: In a period of approximately two years, death statistics plunged by 27,400 - a decrease of 34.5 percent. Re-stated, almost 30,000 “flu deaths” simply disappeared with a series of three CDC press releases.
Indeed, I can’t help but wonder if, one day in the future, maybe 35 percent (or 95 percent) of “Covid deaths” will be eliminated via one entree at a public health agency website.
Note: A published statistic for “Iatrogenic Covid Protocol Deaths” has yet to be published at the CDC’s website.
Hospitalizations:
959,000 (Dec. 2018 Estimate)
810,000 (November 2019 Estimate)
710,000 (Current Estimate)
Note 1: Somehow, the number of people believed to have been “hospitalized” due to flu illnesses plunged by 249,000, a decrease of 26 percent.
Note 2: According to a CDC “Flu Burden” analysis published many months after this season ended, the “national hospitalization rates for all age groups in the 2018-2019 Flu Season were the highest recorded since expanded surveillance began in 2005.”
However, this statement wouldn’t be true just two years later when the CDC wrote that the Flu Season of 2019-2020 (aka “early Covid”) produced more hospitalizations than any flu season for children ages 0 to 4 and adults age 18 to 49.
2018-2019 Flu Season
Cases:
37.4 to 42.9 million (Estimate during this flu season)
35.5 million (later Estimate, January 2020)
29 million (current or final Estimate)
Note: See below for comments on the “tight range” of cases for this flu season compared to the dramatically-larger range of expected flu cases that was widely-publicized during the 2019-2020 flu season.
Hospitalizations:
590,000 (First Estimate.(source: cnbc article from December 2019)
490,600 (Later Estimate)
380,000 (Final or current Estimate)
Note: Over a series of three different estimates, the flu-hospitalization estimate plunged by 210,000 or 35.6 percent.
Deaths:
49,000 (Estimate from December, 2019. Source: cnbc article here).
34,200 (Earlier Estimate)
28,000 (Final or current Estimate)
Note 1: Over a series of three different estimates, the “flu death” estimate plunged by 21,000 or 42.9 percent.
Note 2: Like the subsequent pre-Covid flu season, the 2018-2019 season was classified as “moderate severity,” while the previous flu season (2017-2018) was classified as “high severity.”
Note 3: According to CNBC (which cited the CDC’s preliminary flu season estimates), the 2018-2019 flu season “started off as a mild one but turned out to be the longest in 10 years.” … That is, until the very-next flu season (“early Covid”), which was the “longest” flu season in recorded history.
2019-2020 Flu Season Estimates (Pre-Covid or, as I believe, “Early Covid”)
Note: Flu seasons begin in late September and continue into early May. In the 2019-2020 flu season, cases of ILI were elevated beginning in October 2019 and remained conspicuously-elevated through March 2020. (Covid lockdowns to “stop spread” began on or around March 15, 2020 - at least five months after excess numbers of Americans had begun to fall ill with ILI or Covid-like symptoms).
Cases or flu illnesses:
39 to 56 million (Estimate widely published during this flu season and still being published as of April 4, 2020.)
Note: The median figure from this range is 47.5 million cases, which is 6.5 million more cases than “the worst flu season in 40 years” - the 2017-2018 Flu Season.
35 million (Estimated cases quoted as late as November 2020).
But the revisions weren’t done yet …
38 million (Flu burden estimate, published more than a year after this flu season had finished and utilized through October of 2023.)
34 million - (The “Final Estimate,” published November 15, 2024. Source here.)
Note: The final estimate of flu cases for the 2019-2020 season was published
54 months (4 1/2 years) after the flu season ended in May of 2020, prompting one to ask what “new data” suddenly became available 50-plus months after the actual flu season to prompt these belated revisions.
CDC’s early estimates were awful
The final estimate of 34 million cases is 5 million fewer than the long-used low-end estimate of 39 million cases.
Also, I found it odd that the CDC estimated range of “flu cases” during the prior season was “37.4 to 42.9 million” - a range of 4.5 million cases.
The range used for many months in the 2019-2020 season was “39 to 56 million” - a range of 17 million cases. What grabs my attention is that estimators, at one time and for many months, thought this flu season could have as many as 56 million “flu cases,” which would be an all-time record by large margins (excluding the Swine Flu season of 2009-2010, where few “cases” had “Swine Flu symptoms.”)
To me, this unprecedented “high-end” estimate suggests that some statisticians at the CDC must have thought the 2019-2020 flu season could be a major anomaly or a “historically-bad” flu season - which, to me, would jibe with the theory that a more-contagious “novel” virus could account for this eye-opening ILI estimate.
I also note that these estimates were still being used in January-March 2020, when Covid had become the Greatest Epidemiological Event in the careers of public health experts.
Question: Did not one expert at the CDC or NIH look at their own flu-season “case” estimates and think, “this contagious novel virus might be circulating in America right now?”
If this thought never occurred to any expert, America needs to purge and replace all of its experts and flu-season analysts.
Hospitalizations:
410,000 to 740,000 (Median: 575,000 hospitalizations)
Note: This was the estimate used throughout the flu season and into the spring and summer of 2020)
400,000 (Later Estimate, used through at least September 2023).
380,000 - “Final” Estimate as of November 2024.
Note: The final hospitalization figure was 30,000 less than the low-end figure in the range that had been published for at least 7 months.
Deaths:
24,000 to 62,000 (Median: 43K deaths).
Note: This estimate was used for many months.
20,000 deaths (A later estimate, per Google AI.)
Note: This particular estimate was 4,000 lower than the low-end estimate made throughout the flu season.
25,000 (A later Estimate).
22,000 (Final or current Estimate).
Note: The final death estimate (22,000) is 2,000 lower than the low-end range that had been published for many months.
The 22,000 flu deaths reported for the 2019-2020 flu season is the 2nd smallest death figure from 12 years (going back to the 2011-2012 flu season and including the flu seasons post-Covid through 2022-2023 flu season).
Comparing 2017-2018 metrics to 2019-2020 metrics …
Compared to the 2019-2020 flu season two years later, the 2017-2018 flu season produced 30,000 more deaths (136.4 percent more deaths), 330,000 more hospitalizations (an increase of 46.5 percent) and 7 million more “cases” (an increase of 17.1 percent).
I find all three metics hard to believe.
As will be highlighted in an upcoming story, metrics such as “flu tests given,” “number of schools that closed due to illness” and “consecutive weeks where ILI was (significantly) above the expected baseline” - as well as contemporaneous media stories documenting major flu outbreaks all across America - all suggest that far more Americans were sick in the 2019-2020 flu season than the 2017-2018 flu season.
Aside: I’m still trying to highlight the importance of this metric …
I believe the “school closing metric” might provide the most persuasive or compelling evidence of early spread. The thought here is that thousands of principals did not conspire to close their schools for no good reason. Large numbers of students and teachers were indeed all sick (and out of school due to their illnesses) at the same time.
Something caused unprecedented numbers of schools - by eye-opening margins - to close. I do not believe it’s unreasonable to conclude that this “something” was a contagious and novel respiratory virus.
If, based on more-credible metrics, one concludes that far more Americans were sick in 2019-2020 than the “worst flu season in 40 years,” this would jibe with a hypothesis that posits that “something (“early spread”) was making more Americans sick” this flu season.
On the other hand, if certain officials at the CDC and other government agencies wanted to conceal evidence of “early spread,” they might significantly revise case numbers or metrics dealing with the flu season of October 2019 through March 2020.
Additional observations …
My hypothesis is that the flu season of 2019-2020 (which had essentially concluded by the lockdowns of mid-March 2020) was indeed one of the most severe in many decades for many months (with no official picking up on this possible connection to Covid).
As this article reveals, the CDC’s first “flu burden” estimates (39 to 56 million cases) definitely supported my hypothesis.
However, other statistics later produced and shared by the CDC clearly do not support this hypothesis and strike me as non-sensical or implausible.
I found this text very interesting …
In its next-to-final “Flu Burden” analysis of this season, the CDC published text that does support my view that 2019-2020 was atypical compared to previous flu seasons. Excerpt:
“The 2019–2020 influenza season was atypical in that it was severe for children aged 0-4 years and adults 18-49 years where rates of infections, medically attended illnesses, hospitalizations, and deaths were higher than those observed during the 2017-2018 season, a recent season with high severity.
“… rates of hospitalization in adults aged 18-49 years were the highest seasonal rates seen since the 2017-2018 season.”
Citizens who kept reading learned:
“These rates mean that an estimated 15 million cases of influenza in younger adults (aged 18-49 years), which is the highest number of infections for this age group since CDC began reporting influenza burden estimates in the 2010-11 season.”
In journalism this might be called “burying the lede.” Re-stated: More children and people of working age (18 to 49) became sick than in any year the CDC’s been compiling and publishing “influenza burden estimates.”
In my opinion, a virus that was not necessarily “more deadly” than a typical flu or coronavirus, but was more contagious might indeed make more young and middle-age people than normal sick.
Flu Cases by Season:
2019-2020: 34 million (Original Estimate: 39 to 56 million)
2018-2019: 29 million
2017-2018: 41 million
2016-2017: 29 million
2015-2016: 24 million
2014-2015: 30 million
2013-2014: 30 million
2012-2013: 34 milion
2011-2012: 9.3 million
2010-2011: 21 million
2022-2023: 31 million
Comments:
Oddly, the 2020-2021 flu season - the flu season after official Covid - had almost no “flu cases,” causing many pundits to question how the flu “had completely disappeared.”)
Even reduced from a high estimate of 56 million to a final number of 34 million, the case numbers for the 2019-2020 season are still tied for the 2nd most in the previous 10 seasons and the two subsequent flu seasons.
The average “flu cases” for the 10 flu seasons listed above (not counting 2019-2020) is 27.83 million, revealing that the flu season of 2019-2020 produced 6.17 million more “cases” than the previous 10-year average.
Compared to the mean figure, the 2019-2020 season produced 22.2 percent more flu illnesses - which suggests a more-active flu season, but not by a spectacular degree.
34 million Americans becoming sick with flu-like symptoms in the approximately six months of the 2019-2020 flu season would translate to 10.3 percent of the country experiencing an ILI or 1-in-10 Americans.
Comparisons to the ‘Swine Flu Pandemic’ of 2009-2010 …
For context, the most ILI cases on record happened in the 2009-2010 season when the H1NI “Swine Flu” pandemic occurred.
According to the CDC, that pandemic - in combination with “regular flu” - produced 60.8 million ILI cases - (which would mean approximately 1-in-5 Americans were infected with either Swine Flu or another-circulating ILI).
Note: According to the CDC, approximately half of the ILI cases of this period were Swine Flu and half of the “cases” were traditional viruses.
As Pandemics go, the Swine Flu was very un-deadly
Interestingly, despite an estimated 61 million Americans contracting the Swine Flu or a traditional ILI from April 2019 through April 2020, only an estimated 12,496 Americans (or fewer) died from the Swine Flu H1NI “pandemic,” according to official CDC estimates.
To me, data from the Swine Flu “Pandemic” provides evidence that a widely-circulating virus(es) can be surprisingly non-deadly. (That is, 15 to 16 years ago, 20 percent of the population was supposedly infected by these circulating viruses, but only 0.004 percent of “infected” citizens died.)
I wouldn’t be surprised if 61 million Americans (or, perhaps even more) were infected with either Covid or non-Covid viruses by mid-March 2020.
Aside - Revisiting the Red Cross Antibody Study …
Extrapolations from the Red Cross Antibody Study suggest that 7.4 million Americans might have already been infected by the novel coronavirus in … November 2019 - 4 1/2 months before the lockdowns to “slow” or “stop” virus spread.
Question: If approximately 7 million Americans had already contracted the novel coronavirus by November 2019, how many more Americans would have been infected by a very contagious virus 135 days later?
Here one would need to get into a discussion of the R-ought number, but that figure, in my opinion, could certainly have been more than 60 million Americans.
In my opinion, the mortality data attributed to the Swine Flu seems to show a “novel” virus can be circulating for more than a year and produce far fewer deaths than a typical flu season.
Question: Should it really be impossible to believe that a “novel” coronavirus - circulating pre-PCR tests for six months between October 2019 and March 2020 - could also infect similarly huge numbers of Americans without any noticeable spike in deaths occurring?
I would also note that the number of Americans who experienced “flu-like symptoms” in the months before official Covid was almost-certainly massively higher than the number of Americans who became sick in 2009-2010, when 61 million Americans were reportedly infected with “cases” of ILI or Swine Flu. (Again, the CDC says only 34 million Americans had a case of ILI in 2019-2020).
General Conclusions on Flu Season Estimates created by the CDC …
In my research, I’ve learned that the CDC began focussing on “Flu Burden Surveillance” operations around 2000 with this project ramping up significantly in 2005-2006.
A cursory review of various “Flu Burden” articles reveals a predictable pattern.
Before the agency publishes several revised estimates, the CDC publishes estimates of the number of flu cases, deaths and hospitalizations the agency’s experts predict will or could occur in a full flu season.
Almost always, these numbers are much higher - and, invariably, alarmist and fear-producing - than the subsequent “revised estimates” which are published 1 to 4.5 years after the original statistics were widely-disseminated.
It should be noted these reports are also promoted via a non-skeptical media, news organizations that receive significant advertising from public health agencies and Big Pharma companies which incessantly promote the benefits of vaccines.
A skeptic or cynic can’t help but conclude these reports are being disseminated for one reason only - to encourage every American over six months of age to get that year’s flu shot.
Indeed, I’ve read hundreds of articles about various flu outbreaks. I can’t think of one such story that didn’t include the obligatory quote from a doctor or public health expert(s) who proclaims, “It’s not too late to get your flu shot.”
Many of these same stories also make the point that even if that year’s flu vaccine doesn’t prevent someone being infected by influenza, the shots will almost certainly ensure that any illness a vaccinated citizen might contract will be “less severe” among those who received their flu shot.
IMO, this is another dubious claim, one not supported by any credible studies that quantify the severity of symptoms experienced by the vaccinated compared to the non-vaccinated.
If the flu shots work, why do we keep having tens of millions of flu cases?
If nothing else, information contained in this document (according to the CDC’s own final estimates) reveals that 29 to 41 million Americans contracted flu illnesses in the three consecutive flu seasons from the fall of 2017 through the early spring of 2020.
These outbreak occurred despite the fact that 50 to 52 percent of Americans received each year’s flu shot. At least 70 percent of citizens over the age of 65 received each season’s flu shot.
Indeed, it seems abundantly clear that “flu burden” (the number of citizens who become sick with respiratory illnesses) in America has not decreased since the CDC ramped up its never-ending flu shot advertising/propaganda around 2000 to 2006.
(This observation evokes thoughts of the decades-long “War on Cancer,” a “war” that has clearly resulted in far more cancer cases than when this “scientific”/medical battle commenced. )
This observation suggests one of the great scandals of medical science from the past several decades has gone unreported - Namely, the truth, or apparent truth, that the “flu vaccines” simply don’t work.
The “Effectiveness” of Various Flu Shots
Even Dr. Anthony Fauci has said the flu shots might be effective as little as 10 percent of the time (and, the definition of “effectiveness” is rarely fully defined.)
According to an article from CBS News from December 2017, “On average, past flu vaccines have been about 42 percent effective, though that number can range anywhere from 10 to 60 percent in a given year.”
According to other stories, a good result for a flu vaccine is years when the shot is “50 percent” effective.
If nothing else, data in this dispatch should call into question how “effective” the flu “vaccines” were in the three-consecutive flu seasons analyzed.
While the above excerpt from CBS in December 2017, reported the flu shot of 2017-2018 may have been only “10 percent effective,” a later paper published by the NIH in February 2018 said the “Interim estimates of the effectiveness of the 2017–18 inactivated influenza vaccines against medically attended respiratory were 36%”
(So the “worst flu season in 40 years” could, presumably, have been much worse).
Flu shots apparently haven’t improved as even The New York Times ran a story stating that the flu shot of 2021-2022 “was only “16 percent effective.”
***
According to Google AI, the flu vaccine of 2019-2020 was “39% to 46%” effective “against flu illness across different studies and methods.
Another CDC article stated the flu vaccine of 2018-2019 was estimated to be 47% effective.
This paper did define “effectiveness.”
“This means the vaccine reduced a person’s risk of having to seek medical care by 40%, the CDC found.”
A close look at the main market for flu “vaccines”
However, by vast margins, the largest cohort of the population that does get their annual flu shots has the largest death and hospitalization rates … by vast margins.
According to Google AI, 85 percent of flu deaths are citizens aged 65 or older … Yet 70 percent of people in this age demo receive annual flu shots … Just like the the overwhelming percentage of “Covid deaths” are in the heavily-vaccinated senior citizen cohort.
***
The only story I found that compared flu deaths among the vaccinated and unvaccinated was a CNN article that stated that, in one flu season, 80 percent of children’s “deaths from the flu were among unvaccinated children.”
However, other stories about this flu season noted that only 120 children in the entire country died from “confirmed” flu that year. As America has approximately 73.1 million children under the age of 18, the flu mortality rate was 0.000069 percent (1 death in 609,166 children).
Nor do these stories report how many of the 38 million vaccinated children might have died from vaccine injuries or suffered severe adverse events immediately or years in the future. (If this figure is more than 120 people, parents might want to reconsider getting their child’s flu shot at their next “wellness” visit/vaccine appointment.)
Note: In 2019-2020, a record 52 percent of children under age 18 received flu vaccines (38 million children). As noted above, a record number of children aged 0 to 4 were hospitalized due to flu-like illnesses that flu season.
In retrospect, the Big Pharma public relations savant who came up with the campaign/spin that flu shots reduce the severity of subsequent flu cases should go down in … infamy.
“It worked!” …
In reading a comment thread on Reddit on the bad “flu” outbreak” of December 2019 (“early Covid”), I found numerous posters who stated they or their loved ones had gotten that year’s flu shot and still came down with the flu.
However, one poster (influencer) reminded thread participants it was still very smart to get the flu jabs and even included the sentence that every journalist uses in every newspaper article about a given year’s flu outbreak (see last sentence).
“Getting the flu shot could still mean that the severity and length of symptoms you experience could be drastically shortened, since your body got a head start forming immunities and resistance to influenza.
Get your flu shots, people - most pharmacies won't even charge, or even give store credit to receive one. It's never "too late" to receive a flu shot!”
Number of deaths prevented by flu shot, by season …
No in-depth story on the miracle of the flu vaccine can be complete without mentioning how many lives the CDC says were saved by a given year’s flu shots.
According to Google AI, 7,000 lives are saved in a typical flu season.
For the record, the number of lives saved in the three flu seasons analyzed above were:
2017-2018: 8,000 deaths prevented (plus, the shot prevented 7.1 million illnesses and 3.7 million “medical visits.”)
2018-2019: 3,500 deaths prevented (plus 4.4 million illnesses and 2.3 million medical visits.)
2019-2020: 6,300 deaths prevented (plus “7.5 million illnesses.”)
Note: And these were with shots that were only 10 to 47 percent “effective.”
Of course, 8,000 flu deaths prevented is a thimble of water in an ocean compared to “millions of lives saved” by the Covid “vaccines” … per (of course) the estimates.
A final anecdote …
To tie this article back into “Early Spread” and set-up my next article, I’ll conclude with another “anecdote” shared by a Reddit user who was also commenting on the December 2019 outbreak of something.
“I had it (“early Covid?”) for 3 weeks and I don't even know where I got it. Usually my immune system takes care of it within a week. There's something f**ked about this year’s flu …”
*** (Whew. This took a lot of work and the next article - on why I think Covid is a novel disease - will take even more. Any sub and gratuity support is greatly appreciated!) ***
Hi, Bill. I haven't read even half the article yet, but I couldn't contain my compulsion to add some basic info about the flu vaccines and their purpose.
First, the flu vaccine typically has negative efficacy, which means more people taking the shot get the flu than not. Which is about the same category of efficacy of all preventative vaccines that are hoisted upon us.
Second, the flu fear campaign to get you to juice up seems to me to be a milder variant of the one used to panic most people into getting the COVID death jabs. My next point will probably explain the amplification for COVID...
Third, the COVID psyop was across the board, all-in support from every entity, not just the Big Pharma mafia typical players. You did notice the chyron case and death toll streams at the bottom of every media outlet's video, right? Who organized all that data reporting in real time? That's not something you get without either fake data or multi-industry- and government-wide agreement on data format and reporting. Media, hospitals, clinics, state and local governments, feds... everyone instantly on the same page. And the PCR test all being conducted at 35 cycles when it's well documented it's unreliable even as a high level diagnostic tool at more than 29 cycles (Fraud Fauci even admitted that).
So... all the fear used for flu shots for years was just getting everyone on the same page for the big psyop, kind of like a real world version of the tabletop exercise. It's all part of a multi-decade plan roll out and escalation.
Finally, the entire purpose of all of this is to poison all of us. None of the vaccine efficacy data holds up, especially the legend of the smallpox and other plague eliminations the jab marketers have successfully taken credit for. All those diseases had already stopped killing people BEFORE those jabs where introduced. Just like you found here, if you control what data is displayed, you can rig the stats. Back then, they just started tracking death trends about 6-12 months before those jabs were introduced, so it looks like they stopped deaths. But if you look 1-2 yrs before that and include those deaths, the curve is already at the tail end near the bottom of deaths, with the jab juice having no statistical impact.
The whole thing is a scam, and I think Dr. David Martin's position is correct: they're all designed to harm and kill us slowly while extracting any wealth remaining. As Sasha Latypova and Katheryn Watt have proven, we're worth more to our gov't dead than alive.
OK, sorry. Back to the flu and the damages done there... all of which I think was just psyop training while getting rich for the big one...
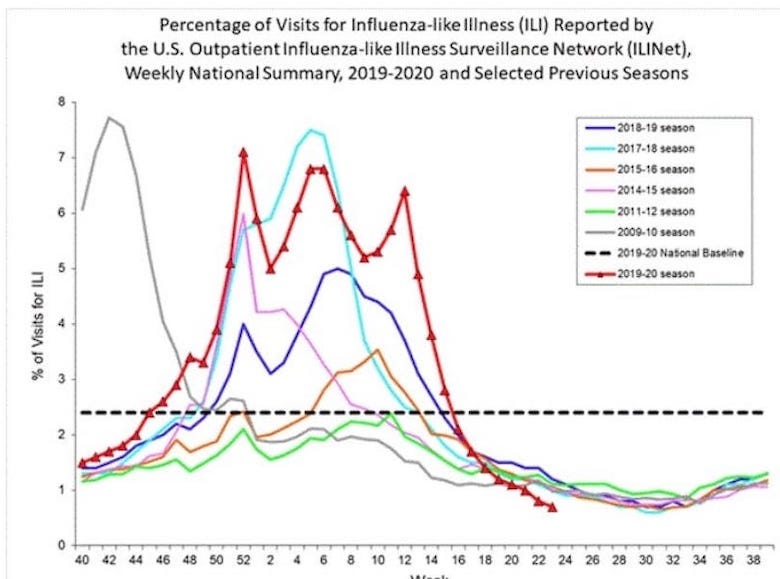
"One of these flu seasons is not like the others" .... Re: The ILI-percentage chart, note that …
2019-2020 is higher than all other flu seasons beginning in Week 40 of 2019 (which is late September). The graph’s ascent/slope is noticeably steeper in October 2019/November. The graph then goes vertical in early December 2019 and peaks in late December, which would be around Christmas (when Tim and Brandie McCain both got very sick). Also, the peak of “early Covid” would have occurred during the Christmas holidays. This means that the “school closing” data I have highlighted actually doesn’t capture when most Americans were “becoming sick.” This is because students and teachers were out on Christmas vacation and, thus, schools didn’t need to close “due to illness.”
In other words, the school closing statistics could have been even higher than 2,866 schools. (The peak of the 2017-2018 flu season happened after school had resumed. Still the 2019-2020 flu season produced approximately 50 percent more school closings than “the worst flu season in 40 years.”)
There is another major spike in late January/early February 2020, when it seems like 25 percent of Troy, Alabama (myself and two of my kids included.) The 2019-2020 ILI percentages are always much higher than the other seven flu seasons (except for six weeks around January 2018, when that flu season peaked.)
However, notice how the 2017-2018 Flu season peaked and then “dropped off a cliff.” This did NOT happen with the 2019-2020 season. Instead, there was another major spike in February and early March (before the lockdowns).
The reason 2019-2020 fell off a cliff around week 14 is this was after the lockdowns and everyone was advised to stay home and officials stopped testing for flu or ILI (the so-called “disappearing flu.”
Still, I think Covid - based on ILI symptoms - probably peaked in late February/Early March 2020.
In my opinion, any novel virus was already tapering out on its own at the time we had the lockdowns to “slow” or “stop spread.”
My next story will again highlight another key metric that’s gotten zero MSM attention - the fact that far more flu tests were given in the 2019-2020 season.
More flu tests were given to patients by doctors in 2019-2020 than all 27 weeks of the prior flu season - by huge margins.